

Map your project area01
Ask Bruce02
Turn insight into action03
01
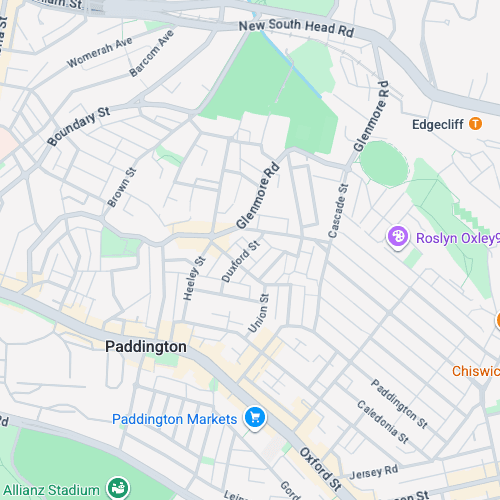
Define your area
Draw your project area, catchment or corridor and get detailed community data for the exact area you define.
Ask Bruce anything about demographics, maps, or strategy...
02
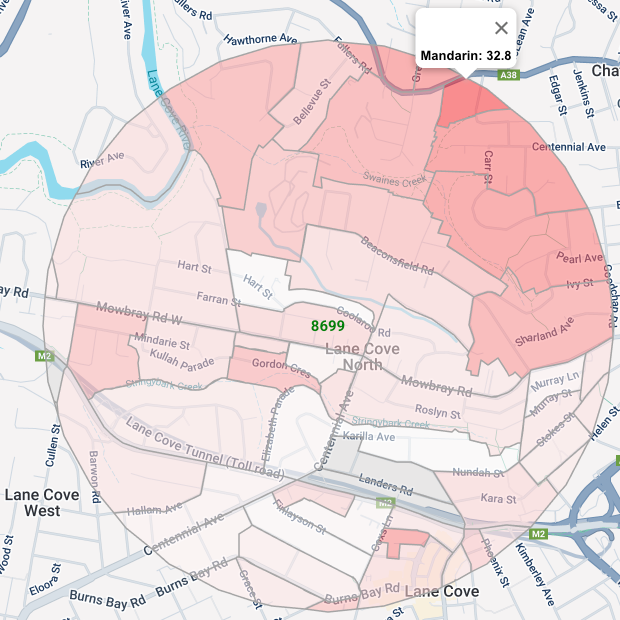
Understand your community
See who lives there, where different groups are concentrated and who may be affected or overlooked.
Identifying Key Stakeholders
Planning Engagement Strategy
Generating Snapshot Report
03
Take action
Use Bruce AI to analyse your community and project data, create reports, plan engagement, build surveys and export addresses.
Stop relying on suburb-wide data
Draw a precinct, corridor, catchment or custom project area and get community data matched to the exact area you define.
Get hours of research done in minutes
Create a Snapshot Report for your exact project area, with community data and insights ready to drop into your engagement plan, SIA or planning report.
Put AI to work on your community data
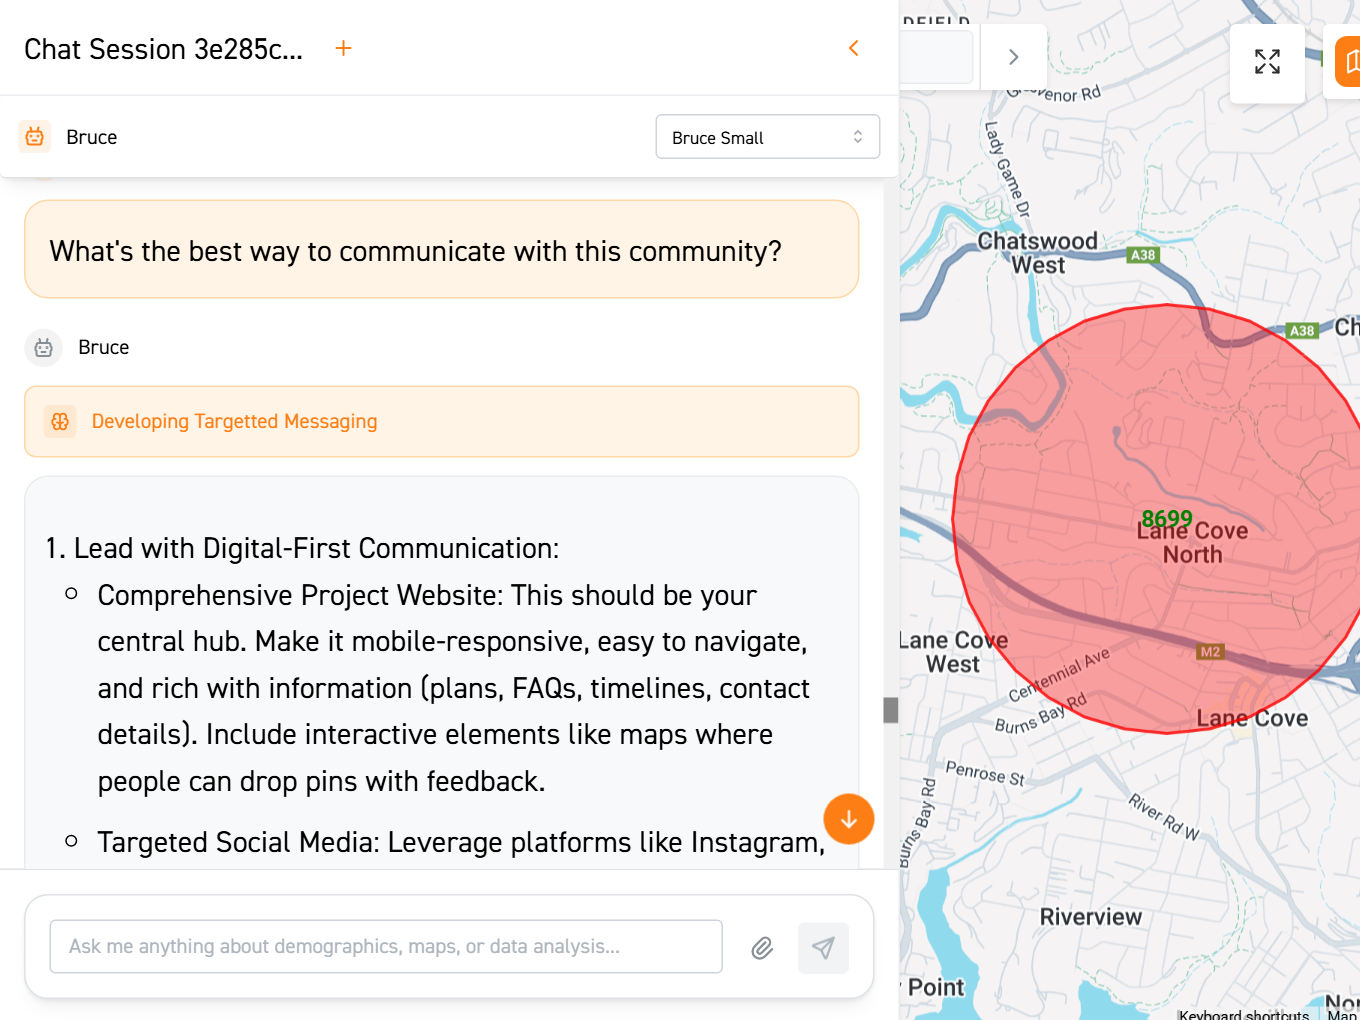
Bruce AI works directly with the community data for your exact project area and any project documents you upload. Ask questions in plain English and get answers grounded in your data and project context, not generic AI responses.
Know who you're hearing from - and who you're not
Build surveys for your project area
Create project-specific feedback forms linked to the area you have defined
Measure representation
See how closely your sample reflects the people in your study area.
Understand your results.
Get a breakdown of community sentiment, issues raised and how representative your respondents are
Map responses and respondents
See where respondents are located and where different issues are being raised
Reach every property in your project area
Export addresses for mailouts, doorknocks or your CRM. See which properties are homes or businesses and which have a letterbox.